
Business Intelligence Case Study: How a Better Data Dashboard Boosted Datascan’s BI Segment
October 17, 2022
Case Study
October 17, 2022
Case Study
Sign up to our mailing list by filling in the form below.
If you have any questions or need more info, let's have a conversation. Schedule one here.
Data analysis can make a notable difference to organizations that invest in the right tools to analyze the significant quantities of data collected throughout normal operations. Datascan are leading inventory experts with multiple inventory solutions. We partnered with them to create a BI-powered, value-added service called DART Smart that they now offer to their own clients. Now, not only can they provide industry-leading inventory services, but they can also help provide direct insights about how exactly clients can make their inventory processing more efficient and accurate, and in-turn, make their business run more smoothly.
The last 15 years have seen an aggressive increase in digitalization among businesses of all sizes for various reasons. This has led to an explosion in the business intelligence services market, as companies have understood the value of the raw data they now had access to.
Business requirements for insights into data, customer analysis, and business processes have increased exponentially as a significant number of organizations pivot to online-first or online-only practices. The inventory management market is no different.
Through business intelligence software, corporations can keep track of every event of the working day in an easy-to-read, quickly digestible format that can help aid decision-making for the implementation of better business strategies.
Commonly, business intelligence software is available on a subscription basis, but the magic happens when you get a set of experts to help you make sense of your data. As an inventory management company, Datascan had all the data in the world, courtesy of their clients.
What they needed was a way to make that data easy to read, and even easier to understand – with the ultimate goal of creating data-driven insights that they could use to improve their service and provide valuable insight to their clients.
Datascan is a self-scanning solution company that provides inventory control solutions for retail brands. They started out as pioneers of barcode scanning systems, introducing both handheld scanners and an online count status and variance analysis software by 1998. By early 2000s, they deployed over 80,000 scanners to be used simultaneously which provided the first wave of data for Datascan’s servers. In 2014, they launched DART, a full-color scanning solution that later added DART Connect, software that can be downloaded to any Android device to aid with inventory count at consumer stores. DART evolved further into a suite of analysis and BI products, one of which – DART Smart – is where Datascan partnered with Cleverbit to create a suite of reports that intuitively visualizes KPIs and allows for easy data navigation.
Datascan’s products are used by several high-value companies including Chanel, Brooks Brothers, Tiffany & Co., Nike, Pandora, and Diesel. That said, Datascan also caters for smaller retail brands as well, providing solutions for companies with a minimum of just 10 brick & mortar stores.
In inventory management, scanning is where errors are most likely to appear. When inventory is counted incorrectly or a tag is scanned improperly, the cumulative costs can be devastating to businesses: from increasing stock holding costs to frequent losses due to overstocking, inventory is the primary reason why big retailers can struggle to turn a profit. Stock loss as a result of administrative errors or inventory process issues can lead to products appearing out of stock, resulting in dissatisfied consumers and issues with rebuilding brand trust.
As experts in the industry, Datascan saw room for business intelligence software that could minimize the risk of loss due to inventory issues for their clients. They wanted to create a subscription-based service that analyzed the scanning process with valuable data that could allow stores to amend their current counting method to avoid these discrepancies.
Partnering with Datascan’s data team, we built DART Smart – a tool that can provide detailed, easy to read reports on every step of the inventory-taking process. Using these reports, users can now analyze their entire process and quantify exactly how specific improvements could potentially impact their inventory taking methods.
For example, Datascan’s newest offering introduces RFID tags, which are significantly faster to count using the latest technology. Through data gathered and visualized through DART Smart, a company with large stocks of physically small products could see huge gains in both inventory-taking efficiency and accuracy using RFID tagging, versus other, more cumbersome methods.
We wanted to design reports that could be read with universal ease. One of the most significant challenges faced by many of Datascan’s clients, especially larger ones, was the consolidation of several sources of data into clear, KPI-driven reports. Datascan had the knowledge to underscore which KPIs were worth following and creating a business intelligence suite was one way of getting that information to their customers.
The DART Smart solution features over twenty pages of reports. KPIs and trends are front and center for each individual business. DART Smart analyses data cumulatively allowing for comparisons with previous results and the discovery of patterns and tendencies. Each report takes a holistic view of inventory key indicators like accuracy, productivity, or scores.
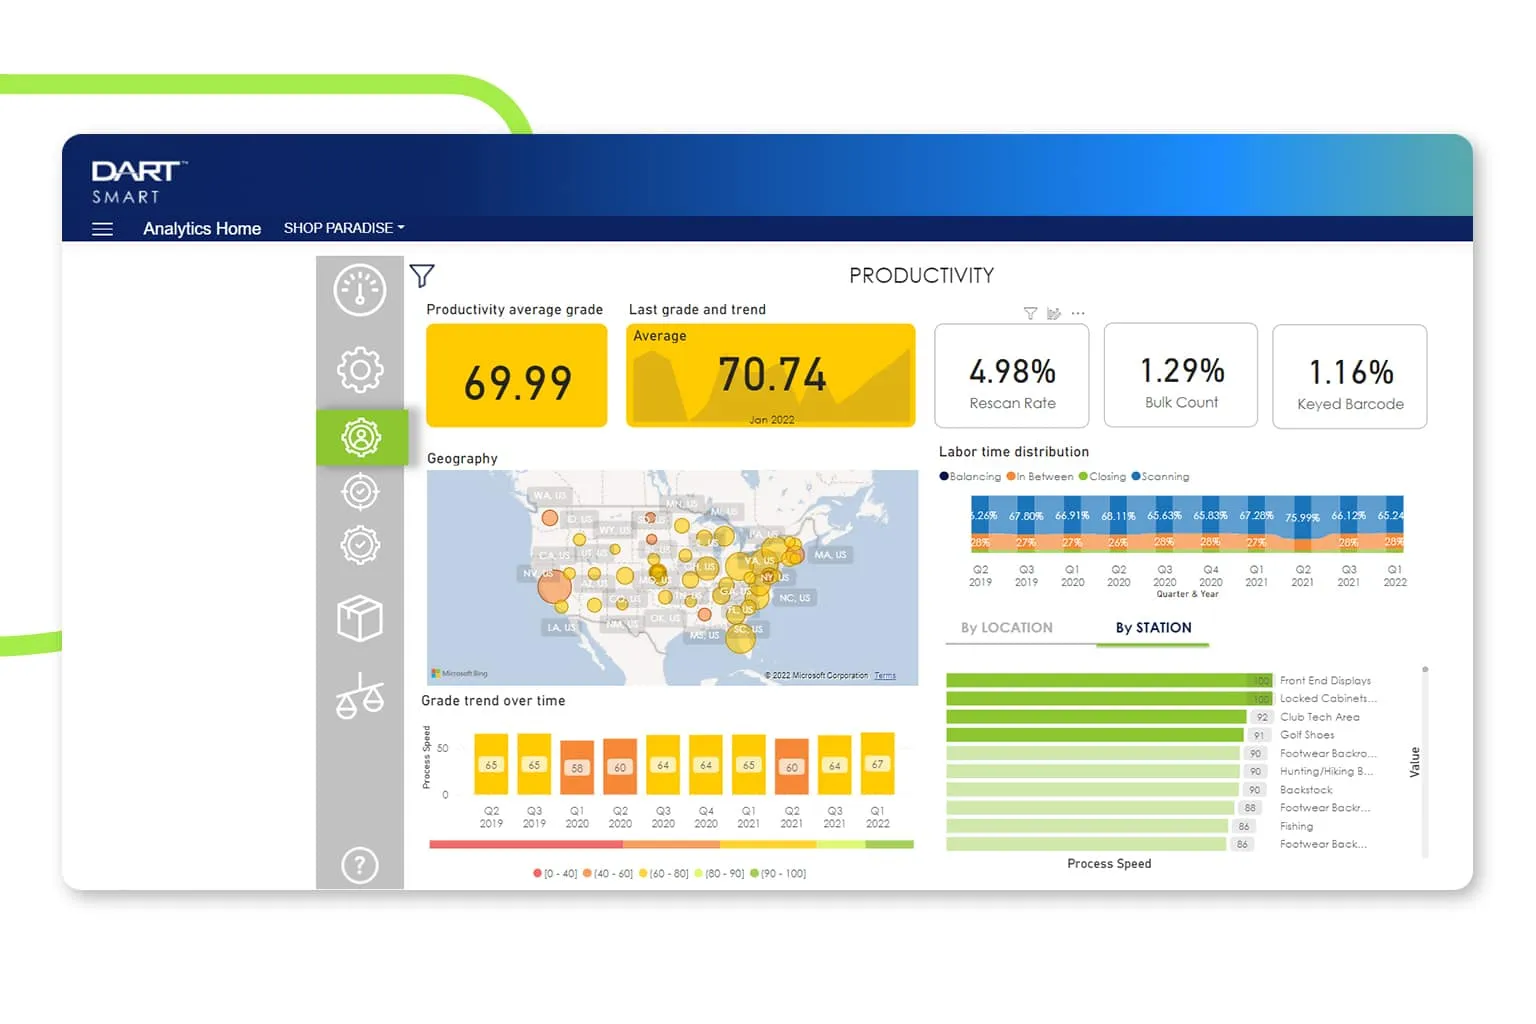
We opted for a simple design that pulled the most important figures to attention through interactive elements. Data can be filtered to further reduce the noise for elements that the company does not wish to monitor as closely.
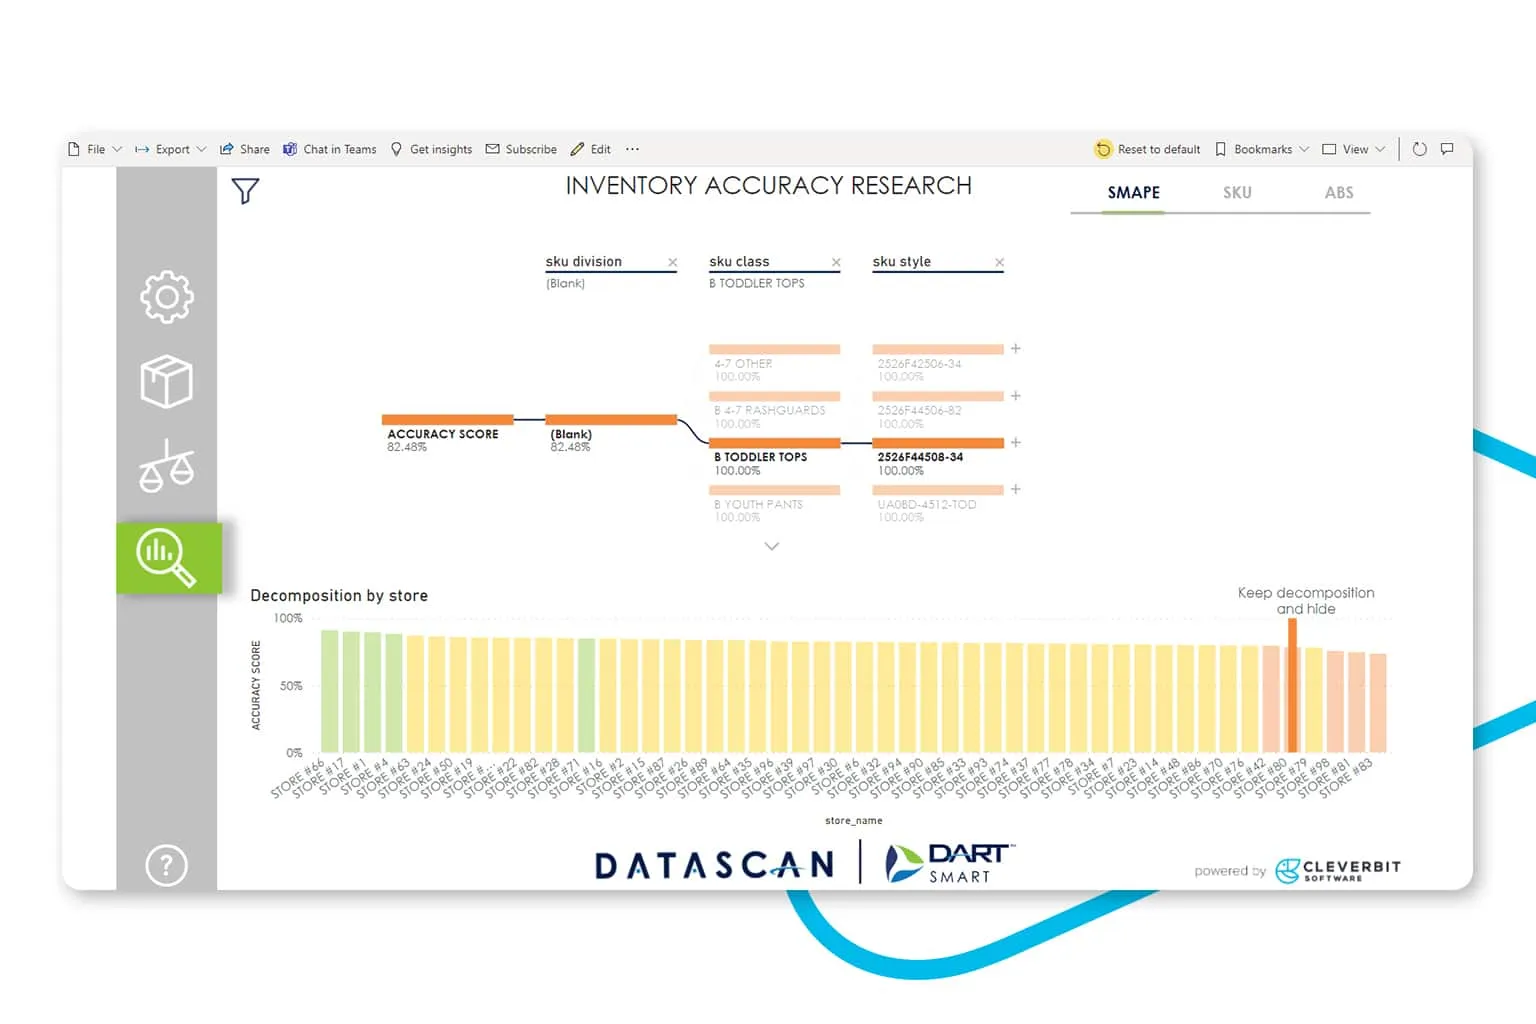
Two of the aspects that Datascan wanted to really emphasize was the performance of the store on the last count. Each report is available on a yearly subscription basis, and it would go into detail on performance, productivity, count accuracy, compliance, and how they performed during inventory, whether inventory happens annually, quarterly, or day to day. The idea is to make it easy for store owners to pinpoint where their stores are struggling and to provide a roadmap to improving their performance. For example, if one of a company’s product warehouses is reporting higher than average inaccuracy, the issues and where exactly they are occurring can be more clearly visualized. With the DART Smart solution, the included report module makes it easier for big businesses to note where and how improvements can be made, and to bolster business decisions through data. The reports produced by the DART Smart solution can then quantify the improvement the business has reached through the changes that were made.
The process of cleaning, filtering, and organizing multiple terabytes of data was worked on in conjunction with Datascan, who took an active role in curating which data needed to be at the focus. Cleverbit’s goal was to design the right data model, as well as, indicators and decision markers for the dashboard to make that flow of data make sense to any business-owner.
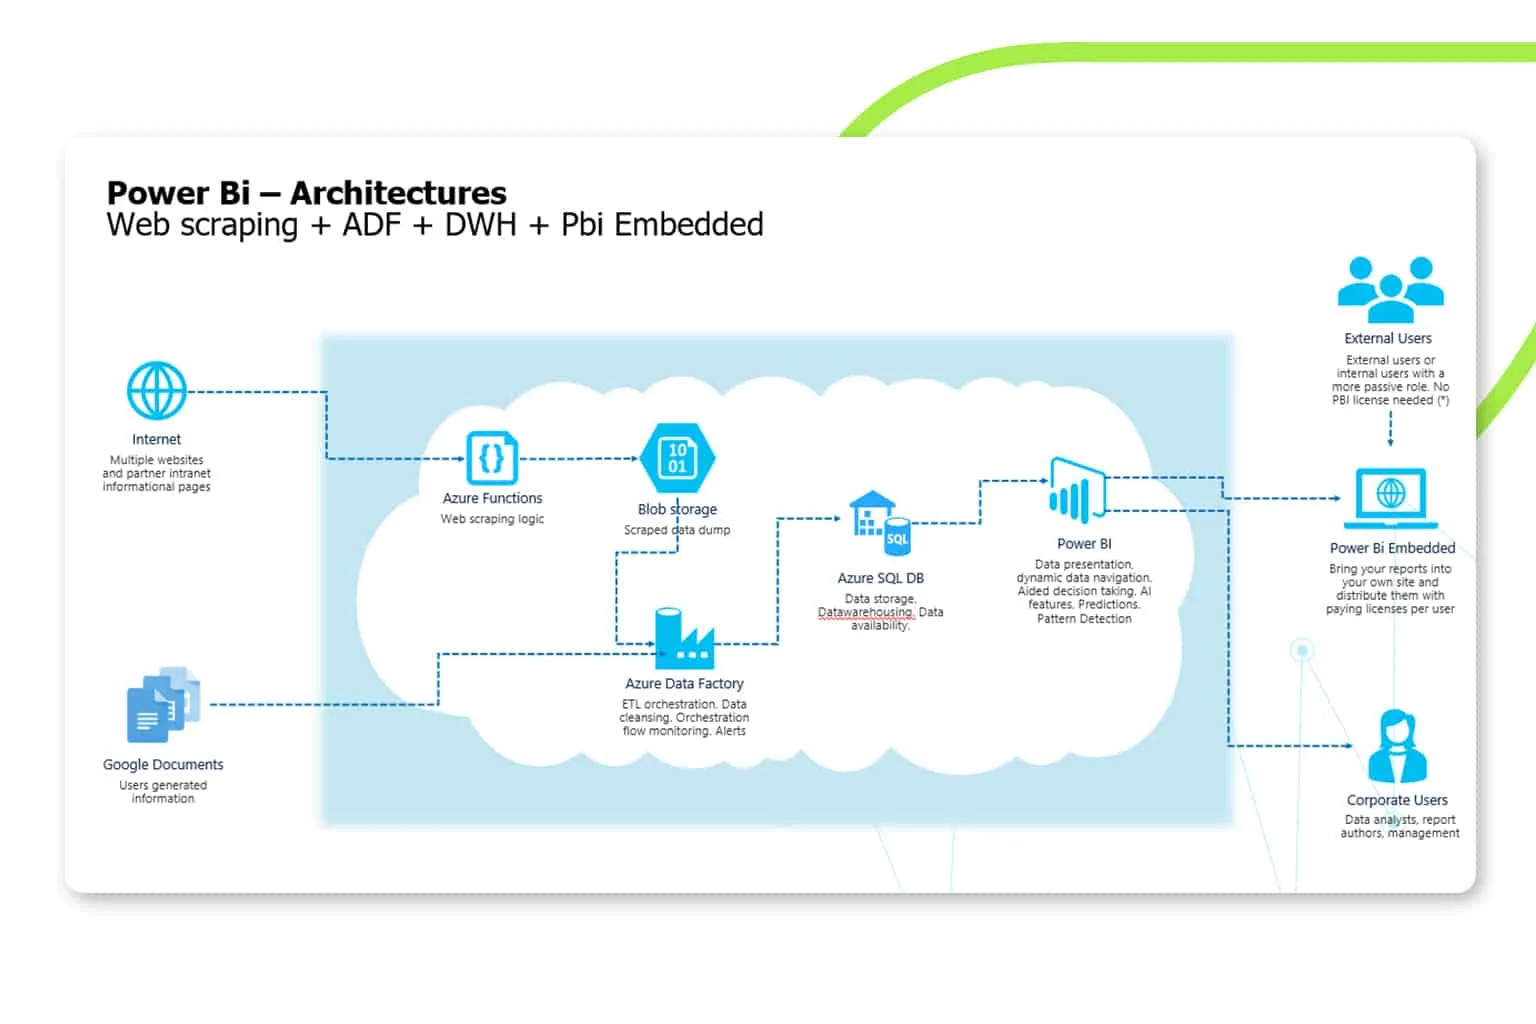
This project, as do most of its kind, required a significant amount of business expertise from the client. We worked closely with Datascan to improve upon their initial plan for a business intelligence software solution by collaborating closely with their team and combining our areas of expertise. Datascan provided the main KPIs and analytic targets that were crucial to the business, and we used that as a framework to design the overall architecture of the software, along with a data warehouse to support the analytics.
Datascan’s team then handled the process that feeds the data warehouse from multiple sources. We then took the data being fed to the data warehouse and produced the visualization platform that produces reports displaying KPI charts, scorecards, insights, comparisons and intuitive data navigation.
Having the data is one part of the puzzle. The rest is figuring out how to make it usable.
Our role was purely based on the data: we needed to not only make sense of everything that Datascan gave us, but also to translate that data into dashboards that could be easy for anyone to read and understand. The challenge of creating understandable visualizations was particularly important: the level of understanding for each of the dashboards had to be universal, allowing retailers full clarity in the state of their businesses.
Furthermore, the data needed to be reorganized in a way that provided valuable, key insights for any client. We used Datascan’s expertise in the industry to isolate the most salient figures for businesses and built the main dashboard’s design around that focus.
Given that it was critical that the way we developed the dashboard fit Datascan’s specific criteria for readability, we worked with them closely to generate a framework that would fit their needs. Work was organized in two-week sprints under the Agile framework, where each week provided Datascan with a fully workable deliverable that could go into production.
Throughout the process, our team had daily meetings both internally and with the Datascan development team. We also provided access to our project management tool so that Datascan could stay in the loop about the status of the project: whether we were ahead of schedule, what tasks were in progress or upcoming, and the estimated date of completion. Critically, they also had control over which features were prioritized over others.
Once the project was implemented, Datascan boosted their overall offering to their clients significantly, and at a cost lower than what any of their clients could achieve by engaging a separate BI service provider for the same insights. Now, not only can they provide an industry-leading range of high-tech solutions in their field, but they can now provide data-driven insights into their clients’ specific style of operation. While the project required an initial investment, that effort will be paid back as soon as the first few clients signed up for the service, and will continue to produce return for the foreseeable future, at the price of regular maintenance.
“I’ve worked for this company for over 20 years and have long dreamed of sharing critical insights buried in our vast data stores. Cleverbit helped make this dream come true – it’s been absolutely amazing to see it become a reality for our clients!”
Herb Billings, the Vice President Product Strategy at Datascan, LP
The process we went through to create Datascan’s BI dashboards may seem long and complex. And for the most part, when it comes to technical adjustments and setup, it is. But the initial steps of understanding where we could provide value to Datascan from a business perspective were just a matter of sitting down and having a conversation.
Generally, this is how it works:
Until this moment, there are absolutely no strings attached. The only commitment from your end is the time we’ll need for you to bring us up to speed with your business.
We’ll present our strategy and a pilot project proposal, and then it’s up to you to decide whether or not to go ahead with it. If the pilot goes ahead, we deliver the project in short sprints, providing actionable data within 2-4 weeks. It’s that simple.
The majority of the time, our clients see huge value from these insights very quickly, and we very often begin another data-driven BI project in another part of their company, based on their needs.
Founded in 2016 and headquartered in Malta, Cleverbit Software is a prominent custom software development company, employing over 70 skilled professionals across Europe. Specialising in custom software for business efficiency, we cater to a diverse international clientele, including sectors in Malta, Luxembourg, Denmark, the United States, and the United Kingdom. Our commitment to delivering tailored, industry-specific software solutions makes us a trusted partner in driving business innovation and efficiency.
Would you like to discuss anything software?
Here's our email:
[email protected]
Here's our phone:
+356 2704 2495